When the price of gas rises, it impacts how people travel, how goods are shipped and how people formulate their budgets. When home heating prices climb, people have to decide whether or not they can afford to turn up their thermostats. When various goods have become more expensive because their components also cost more, people have to make difficult choices on what to buy.
The reason for the above price fluctuations is oil. The price of oil affects individual spending choices. It forces companies to make difficult decisions. It can even change relations between countries. Oil is perhaps the world’s most important natural resource. But what makes it so important? Why is it constantly in the headlines? And why is the price of oil constantly in flux? In this article, we’ll analyze oil and how it makes its way into your daily life.
The Origin of Crude Oil
No one knows exactly how oil was created. But there are two theories that explain how the substance may have originated.
- The first theory suggests that oil is a fossil fuel, meaning it is composed of dead plants and animals that lived hundreds of millions of years ago. After decomposing over the eons, the chemical compounds of the remains broke down and formed what we now call oil.
- Twentieth-century Russian scientists proposed another, “abiotic” theory, which states that oil comes from near the earth’s core, where it eventually flows, much like lava, into puddles underneath the earth’s crust.
Finding Crude Oil
Oil can be found on all of the earth’s continents. Some places, like Australia, have very little, but countries that have large reservoirs of oil are key players on the world stage. After all, they are sitting on top of pools of one of the most important global resources.
Oil is traditionally measured in barrels, and 1 barrel = 42 gallons. Experts say that there are about 1.3 trillion barrels of oil. If you’ve ever read anything about the Middle East, then you certainly know that it is the center of the world’s oil supply. The region sits on top of a liquid gold mine; experts estimate the region holds more than 700 billion barrels of oil in its various fields and reserves, or roughly 56% of all the world’s resources.
he nation that has the most oil — in not just the Middle East but the entire world — is Saudi Arabia. The kingdom, also the spiritual home of Islam, reportedly has more than 250 billion barrels. The other Middle Eastern nations, all with sizable quantities, have about one-half of what Saudi Arabia has in reserves. These nations include Iraq, Iran, Kuwait and the United Arab Emirates. In total, the region’s vast supplies of oil make them an integral part of the world economy.
Canada, which has close to 200 billion barrels within its borders, has the second-largest amount of proven oil reserves in the world. However, much of these reserves are located in Alberta’s “sand pits,” a terrain that makes the oil harder to extract from the earth than it is in other countries. However, technological innovations are expected to make extracting oil located in this kind of terrain easier. (Learn more about the relationship between Canada and oil in “Commodity Prices And Currency Movements.”)
Other nations with large reservoirs of oil include:
- Libya
- Venezuela
- Nigeria
- Mexico
- Indonesia
- the EU nations
- Brazil
- China
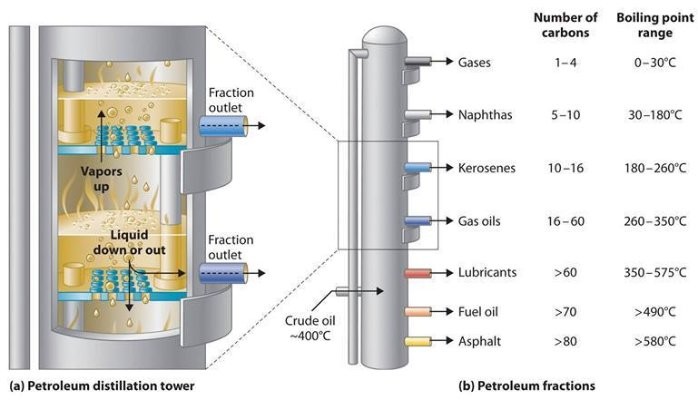
Refining Crude Oil
Before oil can be used, it has to be broken down in a process known as “refining.” After being purchased, oil is shipped to various refineries around the world. In America, many (but certainly not all) of the oil refineries are located in the Gulf Coast region. This is a reason why oil costs tend to fluctuate during storm season. A large hurricane, for example, puts oil supplied at the refineries at risk of destruction. (Oil companies have been at the center of some environmental problems in recent decades. Read more about oil producers and the environment in “The Green Marketing Machine.”)
Refining oil works in an easy way. Crude oil is put into a boiler and turned into a vapor. From there, the vapor moves into a distillation chamber, where it is turned back into a liquid. Different types of oil are formed depending upon the temperature they were distilled at. Gasoline, for example, is distilled at coolertemperatures than residual oils that are used to make products, such as asphalt and tar.
After the many substances made from oil are processed, they arrive in various products to do a little bit of everything, from heating our homes to powering our cars.
Oil Uses
It makes sense that the world’s biggest economies would use the most oil. America, which has the world’s biggest gross domestic product (GDP), also consumes more oil than any other nation. The U.S. uses almost 25% of the estimated 80 million barrels of oil produced around the world every day.
The phrase “America’s dependence on foreign oil” is mentioned often in the media, particularly in reference to American imports from the Middle East. However, this statement doesn’t accurately tell who supplies the U.S. About 34% of all of the oil America uses comes from reserves found in the 50 states. The country that exports the most oil to America is Canada, with Saudi Arabia second. The European Union (EU) also uses a large percentage of the world’s reserves, going through approximately 14.5 million barrels daily. Other nations who have large, established economies – Japan, Canada and South Korea rank high on the list of the world’s biggest oil consumers.
One country that may play the biggest role in world oil consumption is China. China currently ranks as the third-biggest oil consumer on the planet. But with its dynamic and fast-growing economy, China’s usage of oil is forecasted to grow exponentially. Analysts have said that China’s demand for oil grows by approximately 7.5% a year. This increased demand – along with the growing energy needs of countries like India and Brazil – has been a contributing factor in the rise of oil prices over the past few years.
These countries act as the demand for the world’s oil supplies. However, the way oil is priced does not reflect that of the free market. (To learn about the most common way goods’ prices are determined, see our Economics Basics tutorial.)
OPEC’s Impact on Oil
One body has great influence over the worldwide price of oil. The Organization of Petroleum Exporting Countries, more commonly known as OPEC, is a cartel made up of 12 of the world’s biggest oil-producing nations, including all of the major Middle Eastern states, Venezuela and Nigeria. According to OPEC, this cartel controls 78% of the world’s known oil reserves. The major oil producers not in OPEC include Russia, Canada and the U.S.
Since the OPEC nations produce so much of the world’s oil supply, they can manipulate the price per barrel depending upon how many barrels per day the group will sell on the world oil market. If the group wants the price to rise in order to make more money, they can reduce the amount of oil contributed to the world market. And if they want the price to dip — high energy prices drive down demand from OPEC’s consumers – they can release more barrels to the market.
Types of Oil and Pricing
One might assume there is only one type of oil, but that’s far from the truth: There are 161 different types, each with its own consistency, chemical breakdown and potential for use.
Even though there are so many forms of oil, we typically only cite only one price for a barrel. This is because oil traders have selected the most widely used types of oil to determine the price per barrel. For instance, one common type of oil found and used in America is called West Texas Intermediate (WTI). West Texas Intermediate’s popularity is due to it being a “light and sweet” oil, which is easy to break down in the refining process. Since this oil is purchased quite frequently, it is used as an industry standard.
Other price benchmarks are used globally. Most European nations use the Brent Blend, found in the North Sea, as their benchmark price. Another heavily used benchmark is the OPEC basket, which combines the prices of several other popular types of oil from around the world into a “price basket.”
And while oil can be purchased directly (in what is called the spot market), the commonly cited price per barrel does not reflect what a customer pays. Instead, the price bandied about has been sold on the futures market. In America, WTI crude-oil futures are traded through the New York Mercantile Exchange (NYMEX). European oil futures are sold through Intercontinental Exchange’s London branch. Globex is another popular commodities market where oil futures change hands. (Get an education on how futures work at Futures Fundamentals.)
Understanding the Oil and Gas Price Correlation
There is a limited positive correlation between crude oil and natural gas prices. It seems logical there would be a positive correlation between the commodities, especially since natural gas is often a byproduct of drilling for crude oil. While at times crude oil and natural gas have had a positive correlation, the markets for each commodity are substantially different and subject to differing fundamental forces. Statistical analysis shows there are periods of positive correlation, but generally the two have limited correlation.
Correlation Coefficient of Natural Gas and Crude Oil
The correlation coefficient is a statistical measure of the extent to which the price of natural gas and crude oil move together. It is also a measure of the degree to which the prices move together. The correlation coefficient is measured on a scale of -1 to +1. A measure of +1 indicates a perfect positive correlation between two asset prices, meaning the prices of the assets move together in the same direction to the same degree proportionally all of the time.
A measure of -1 indicates a perfect negative correlation. This means the asset prices move in the opposite direction of each other in the same proportion all of the time. If the correlation coefficient is zero, it means there is no relationship between the two prices. The correlation coefficient is often used in the construction of portfolios by providing a statistical measure of the diversification of the assets in the portfolio.
Oil and Gas Correlation Data Sources
The Energy Information Administration (EIA) provides historical data for the daily correlation between commodities on a quarterly basis. This information indicates the correlation between crude oil and natural gas is falling. For example, in 2004, the average quarterly correlation between the two prices was around 0.45. This is a moderate positive correlation.
In 2010, this correlation average fell to -0.006, showing there was very little relationship between the prices. In 2014, the average correlation was 0.075. This also indicates very little correlation. However, the first two quarters of 2015 show an average correlation of 0.195, which is slightly positive. Prices for both commodities generally fell during this period.
The highest correlation was in the third quarter of 2005 with a measure of 0.699. The lowest correlation was in the third quarter of 2010 with a negative correlation of -0.21. In general, the correlation is falling. The EIA notes this is due to the increase in shale oil natural gas production.
Impact of Natural Gas Production on Oil Prices
Natural gas oil production has increased dramatically with the discovery of new shale drilling technologies. Between 2007 and 2012, natural gas production from shale drilling rose by a whopping 417% and overall production increased by around 20% during the same period. Natural gas prices have shown greater volatility historically than crude oil prices, while low natural gas prices have led sectors such as the transportation industry to use more natural gas over crude oil. Natural gas usage in the transportation sector grew by 22% from 2007 to 2012.
Crude Oil Production Impact on Prices
Shale drilling technologies have also led to expanded crude oil production. Daily crude oil production increased from 5.35 million barrels per day in 2009 to 6.5 million barrels in 2012. Production in 2014 grew even more to 8.7 million barrels a day. Estimates for 2015 indicate this number will likely grow even larger.
This increased production is one of the reasons for the dramatic drop in oil prices from 2014 to 2015. Oil was trading at over $105 a barrel in June of 2014 and by late January 2015, the price cratered to around $45 a barrel. Supply was outstripping demand and increased production combined with lower demand has hurt prices. Further, economic uncertainty across the globe has called into question the strength for future demand.
The Bottom Line
Oil is one of the world’s most important commodities, and as a result, the nations that control the bulk of the world’s supply have (and exercise) a great deal of power over its availability. The supply of oil in the world market has an impact on its price, and the fluctuations are passed on to consumers, especially in nations that use a lot of oil, such as the U.S. Oil prices are also determined by quality and ease of refining. Investors have the option of investing in oil futures, which themselves have an influence on the price of oil that is reported. The oil market is quite complex, and a better understanding of how oil gets to you from the ground in all its forms will help you to understand and deal with fluctuating prices.